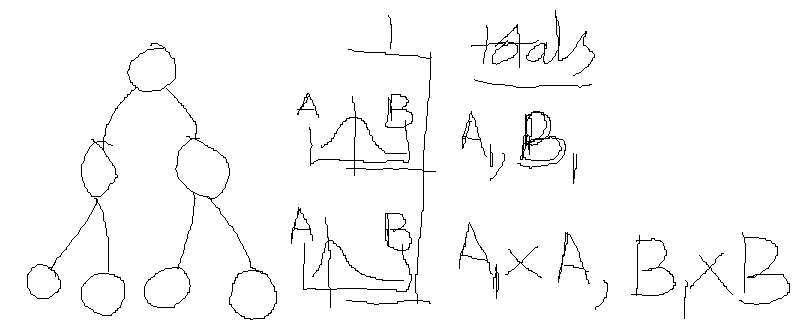
I want to be able to graphically show the following idea. comsider a tree structure where each node can have X children, the number of children X falls between 2 numbers A and B but the probability of any one number is given by a normal distribution the distribution can be both pinched and skewed to a varying degree. All of this will alter the number of vertices throughout the tree.
So I need to control;
- the depth of the tree
- the skew of distribution
- the overall range of values, ie possible number of children at each level
- the median value, this will skew the data